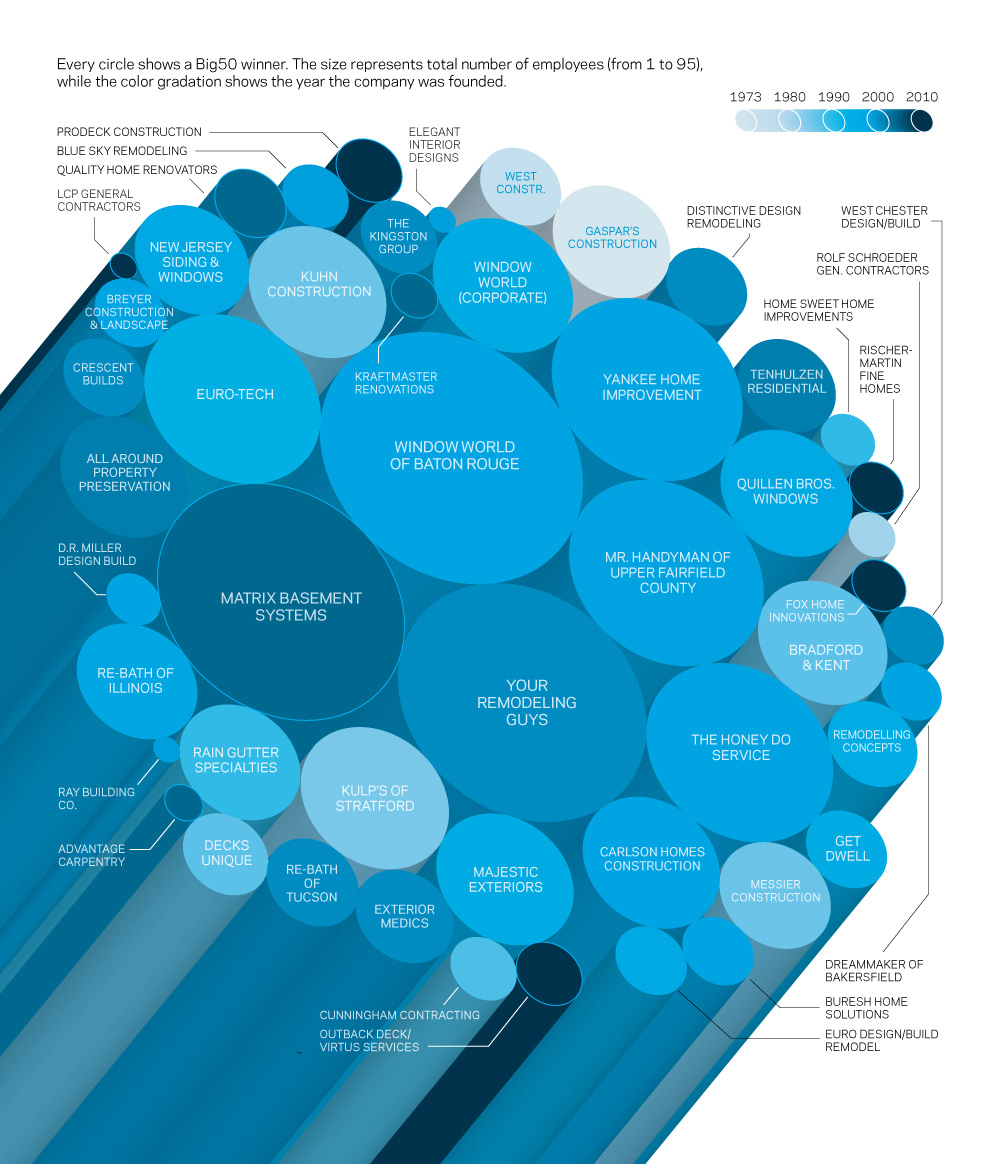
Small, Everyday Charts
Here you can find information graphics that are more simple and smaller. There are ways to present simple data found in databases and tables in attractive graphical form, which makes it easier to understand and less intimidating. These simple infographics tell a story with visuals rather than in words or numbers and can help readers grasp the substance of the findings quickly.